Data Types and Scales of Measurements in Statistics
This Blog describes the identification of data types and measurement scales for software measurement and metrics.
CMMI Model has five Maturity Levels, it starts from Level 2 to Level 5. Levels 4 and 5 in the CMMI are called high maturity and are largely considered with quantitative improvement.
At CMMI level 3, work is managed, and standard processes are used. After level 3, process performance needs to be known quantitatively. High maturity means we have the data to understand how the process is working, how deviation in the implementation and execution of the process affect performance.
Management involving statistical thinking and the correct use of a variety of statistical techniques, such as run charts, control charts, confidence intervals, hypothesis testing etc.
Before applying statistical techniques like prediction model like linear regression, ANOVA, hypothesis testing, etc. we must know the data types and scales of measurement.
Data Types are an important concept of statistics, which needs to understand to apply correct statistical measurements to your data. This blog post will introduce you to the different data types and scales of measurement which you need to know, to do proper statistical data analysis.
Having a good understanding of the different data types, also called measurement scales, is an important prerequisite for doing quantitative Data Analysis. You also need to know which data type you are dealing with to choose the right statistical methods.
The scale determines the amount of information contained in the data. The scale indicates the data summarization and statistical analyses that are most appropriate. Think of data types to categorize different types of variables. We will discuss the main types of variables and look at an example for each. We will sometimes refer to them as measurement scales.
Statistical data can be classified in several ways. Here we provide an overview of the major types of data in statistics.
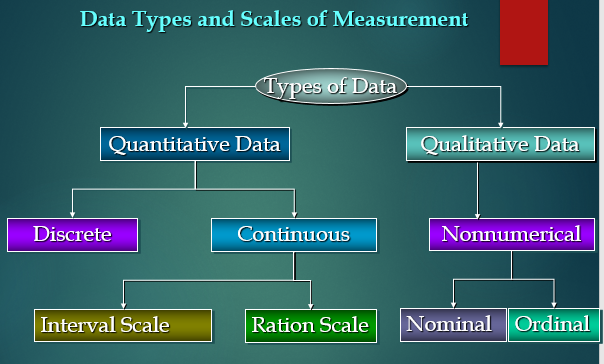
The appropriate statistical analysis depends on whether the data for the variable are qualitative or quantitative.
Quantitative Data: Data that can be measured with numbers, such as time, weight, number of participants, Number of defects, effort required to complete the task. It is called Numerical data.
Qualitative data: Data can be represented by a name, symbol, or a number code. It is called Nonnumerical data that is usually textual and descriptive like female, most favorite, yes/no.
Within quantitative data, there is a sub-level of data types: discrete and continuous data.
Discrete data: It is a whole number (integer) and it cannot be subdivided into smaller and smaller parts. Classic examples are the
- # of resources in a Project
- # of projects in each Business unit
- Types of defects
Continuous data: Continuous data is of the type that must be measured as against the type that we can count. Consider for example Resolution Time that time required to complete the service ticket. Resolution Time can be between 1 hours and 2 hours, it can be 1.5 hours, it can even be 1.54 Hours depending upon the number of decimals and the degree of precision that have been decided in the data collection.
Classic examples are the
- Efforts required to complete the task or project.
- Resolution Time of Service request
- Time required to Processing order.
Continuous data can be further categorized into a couple of types: interval and ratio
Interval scales are numeric scales in which we know both the order and the exact differences between the values. It captures information about the size of the intervals that separate the classes, so that we can in some sense understand the size of the jump from one class to another. For Example,
- Temperature ranges in Celsius and Fahrenheit
- Project Scheduling
- Requirement Analysis: 4 Weeks
- Design : 5 Weeks
- Coding : 7 Weeks
Ratio scales comes to data measurement scales because they tell us about the order, they tell us the exact value between units, AND they also have an absolute zero–which allows for a wide range of both descriptive and inferential statistics to be applied. Good examples of ratio variables include
- Length, Distance
- Execution Time of a Program.
Nonnumerical or Categorical data can be further classified into two types: Nominal and Ordinal
Nominal Scales defines or categories and the place each entity in a class or category, based on the value of the attribute.
Example:
Classification of defects
- Specification Error
- Design Errors
- Codding Errors
Ordinal scales are useful to augment the nominal scale with information about an ordering of the classes or categories
For Example:
- Measuring Complexity of software modules,
- Low Complex
- Medium Complex
- High Complex
Conclusion: Data type is an important concept of statistics, which should be understood to implement statistical methods or procedures correctly. Proper knowledge of data types is necessary to analyze data sets with appropriate statistical methods.

Write a comment
- Sachin Desai February 13, 2020, 1:09 amUseful information for practitioners implementing CMMi, six sigma in organisationsreply
Subscribe To Our Newsletter
Join our mailing list to receive the latest blogs and updates.