An Introduction to Tools for Monitoring Web Services & Applications
.png)
Monitoring to web service/ application is a difficult task. However, monitoring provides us with the capability to detect and diagnose the web application. In today's article, we will discuss some monitoring tools and create a friendly dashboard using the App-metric, Grafana and Prometheus.
Prometheus
Prometheus is an open-source system for monitoring and alerts. It is developed by SoundCloud a lot of company now adopting it. A vast community also supports this project. Prometheus also joined the cloud-native computing foundation in 2016.
More details visit to https://prometheus.io/
Grafana
Graphene is an open-source visualization tool that can be used to display various dashboards using different types of databases. It will most of the time operate with graphite, InfluxDB and Prometheus; a vast community also supports it.
For More details visit to https://grafana.com/
App Metrics
App Matrix is one of the famous open-source, cross-platform .net library. App metrics can run on the .net core application. It is also supporting .net 4.2+ framework.
For More details visit to https://www.app-metrics.io/
Creating Dashboard
For creating the dashboard, we will follow the following steps:
- Install the App-metrics component web API application.
- Configure the App-metrics for Prometheus.
- Create Prometheus server.
- Create Grafana server.
- Test the server
Install the App-metrics component web API application
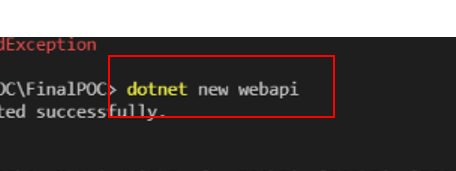
1. Open VS code terminal and run following command
2. Install App.Metrics.AppNetcore from Nuget3. Install App.Metrics.AppNetcore .Endpoints from Nuget4. Install App.Metrics.AppNetcore .Tracking from Nuget5. Install App.Metrics.AppNetcore .All from Nuget
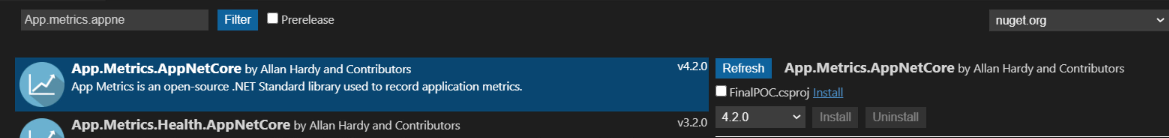


6. Install App.Metrics.AppNetcore .All from Nuget

Configure the App-metrics for Prometheus.
1. Use the following namespace in program.cs
using App.Metrics;
using App.Metrics.AspNetCore;
using App.Metrics.Formatters.Prometheus;
using Microsoft.AspNetCore.Hosting;
2. Change the CreateHostBuilder method code with following code :
public static IHostBuilder CreateHostBuilder(string[] args) {
return Host.CreateDefaultBuilder(args)
.UseMetrics(
options =>
{
options.EndpointOptions = endpointsOptions =>
{
endpointsOptions.MetricsTextEndpointOutputFormatter = new MetricsPrometheusTextOutputFormatter();
endpointsOptions.MetricsEndpointOutputFormatter = new MetricsPrometheusProtobufOutputFormatter();
};
})
.ConfigureWebHostDefaults(webBuilder =>
{
webBuilder.UseStartup<Startup>();
webBuilder.UseUrls("http://localhost:5000");
});
}
3. Add following in line ConfigureServices method in Startup.cs file
services.AddMetrics();
4. Run the application and check is you web API has enabled the metrics endpoint, following Url :
http://localhost:5000/Metrics-text
5. If web API application displays some data, that means metrics endpoint working fine.
Create Prometheus server
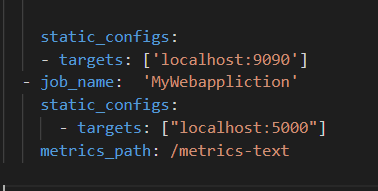
1. Go to https://prometheus.io/download/2. Based on OS download the ZIP/Gz file3. Extract downloaded file4. Open the prometheus.yml file in VS Code5. Add following Line in prometheus.yml6. Run the prometheus.exe7. Open the http://localhost:9090 Url8. Now your Prometheus serve is read to use.
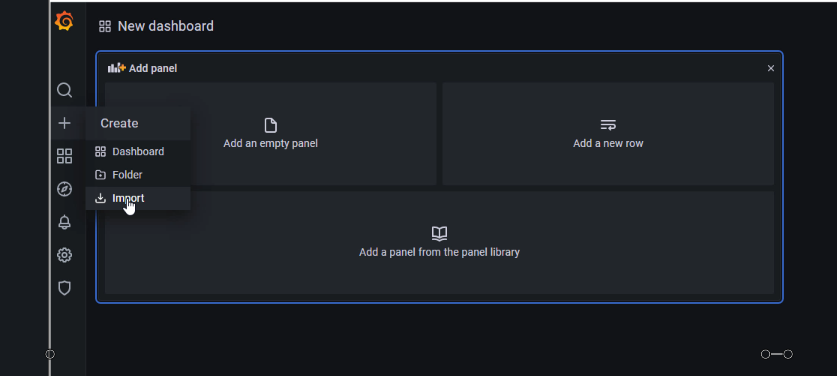
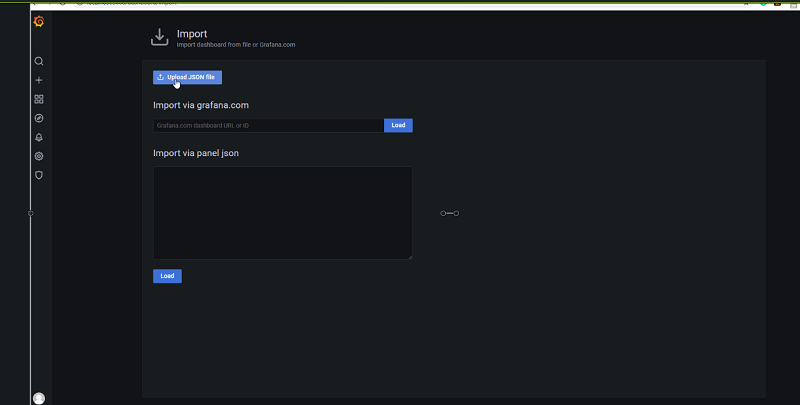
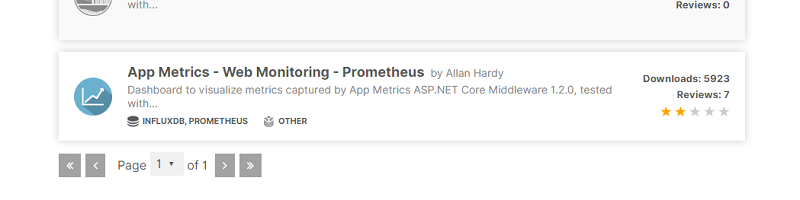
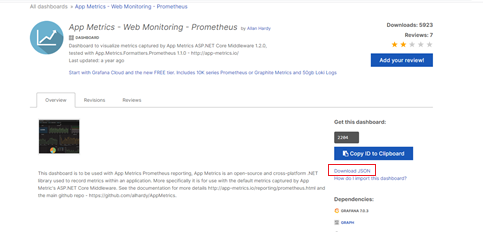
1. Download Grafana based on your system OS2. Extract downloaded file3. Go to Bin folder4. Run grafana-server.exe5. Open the http://localhost:3000 (It is default URL of Grafana )6. Grafana Server displays a login screen7. Enter Admin as username and password8. Click on plus button on side menu bar9. System display following screen10. Go to the https://grafana.com/grafana/dashboards11. Search Web Monitoring and click on App Metrics- web Monitoring - Prometheus12. Download the json file13. Come back to Grafana server URL14. Upload the json file.15. Server displays the dashboard
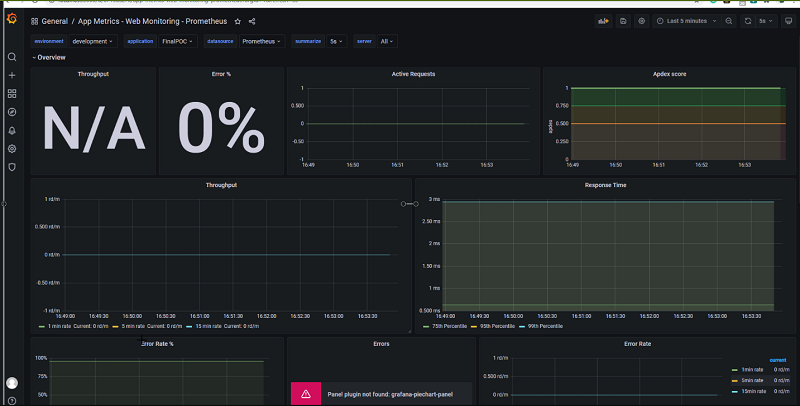
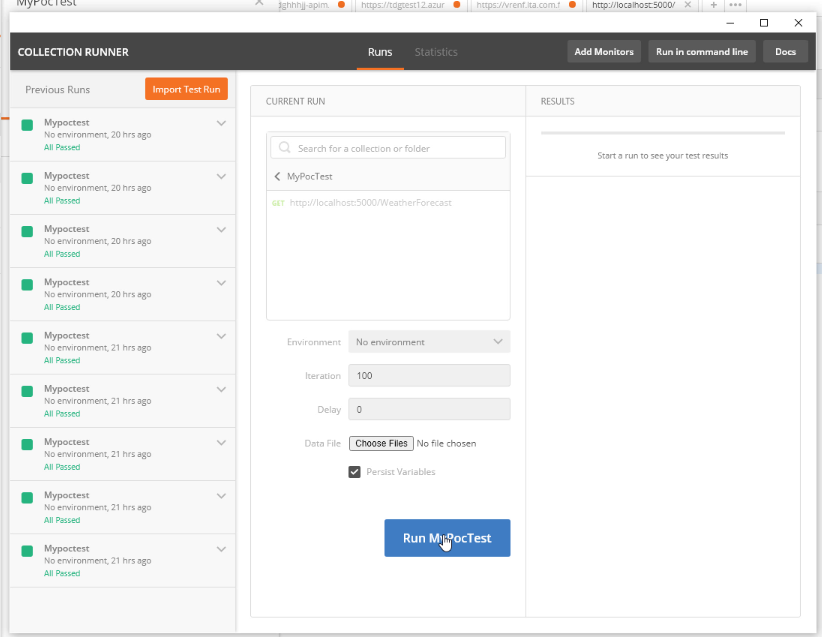
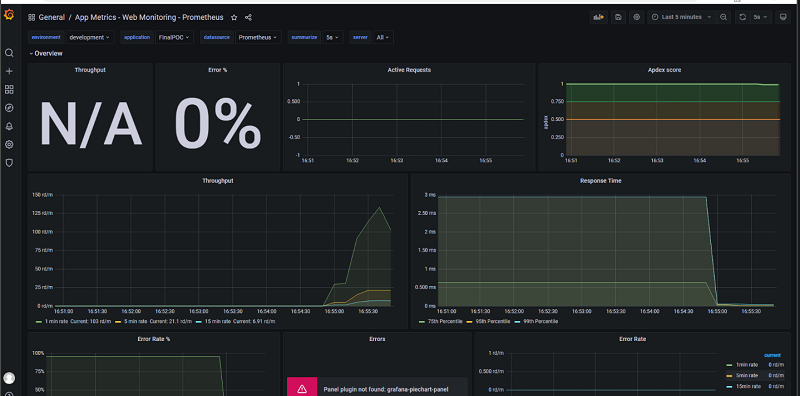
Test the server
1. Open Postman and ping to our web API 100 times2. Now our dashboard is updating.

Write a comment
Subscribe To Our Newsletter
Join our mailing list to receive the latest blogs and updates.